[vc_row][vc_column][vc_column_text]7 per cent growth rate new bottom line
By Parsa Venkateshwar Rao Jr
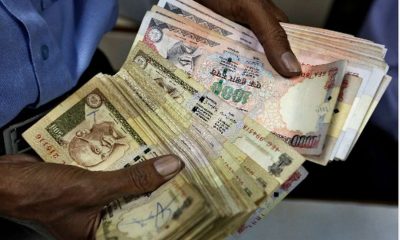
It is surprising that anyone should be surprised, shocked, elated, satisfied that that Quarter 3 economic indicators have not really gone down, and therefore infer that the November 8, 2016 demonetisation has not had any negative impact on the economy. A closer look at the figures shows that the numbers reveal no good news.
First, Q3 figures are lower than those of Q1 andQ2 for 2016-17. At constant prices (2011-12), the growth rate for Q 1 was 7.2 per cent, for Q2 it was 7.4 per cent and for Q3 7 per cent. At current prices, the figures are: Q1 (10.8 per cent), Q2 (11.8 per cent), Q3 (10.6). The sense of relief seems to arise from the fact that it was not as bad as expected. But in absolute terms, there is a distinct slip in Q3 compared to Q2, and a little less when Q3 figure is juxtaposed with Q1. To infer from this that demonetisation has not dampened growth figures is permissible indulgence but it does not speak well for the economy.
There is also need to compare the figures with 2015-16. The revised growth rate for 2016-17 is projected to be 7.1 per cent, compared to 7.9 per cent for 2015-16. The new measure for growth rate, the Gross Value Added (GVA) figure at constant prices shows that the projected growth rate for 2016-17 will be 6.7 per cent compared to the GVA growth rate of 7.8 per cent in 2015-16. It can once again be argued that this has nothing to do with demonetisation.
The other crucial indicators also show that the economy is not really picking up, demonetisation or no demonetisation. The mining and quarrying sector is set to grow at a GVA of 1.3 per cent in 2016-17 compared to 12.3 per cent in 2015-16. In the manufacturing sector, the estimated GVA growth rate for 2016-17 is 7.7 per cent compared to the 2015-16 growth rate of 10.6 per cent. The wholesale price index (WPI) for manufactured has moved from the negative territory of – (1.3) per cent in April-December 2015-16 to 2.3 per cent in April-December 2016-17.
The only positive growth figures, apart from agriculture, are in electricity, gas, water supply and other utility services, where a 6.6 per cent growth rate is expected for 2016-17 compared to the 5.1 per cent growth rate figure for 2015-16. The Index of Industrial Production (IIP) figure for electricity for April-December 2016-17 is 5.1 per cent compared to 4.5 per cent for April-December 2015-16.
Construction, one of the drivers of growth, is expected to grow at GVA rate of 3.1 per cent in 2016-17 compared to 2.8 per cent in 2015-16. Cement consumption during April-December 2016-17 has increased by 2.8 per cent, and steel consumption by 3.3 per cent. It can be seen that there is no great spurt in growth as such.
In the service sector, comprising trade, hotels, transport and communication as well as broadcasting, the GVA growth rate for 2016-17 is expected to be 7.3 per cent compared to 10.7 per cent in 2015-16. The figure of 10.7 per cent growth in the sales tax collection in the states’ accounts between April-December 2016-17 is neither here nor there.
Growth in financial, insurance, real estate and other professional services is estimated to grow at the GVA basic prices (2011-12) by 6.5 per cent compared to 10.8 per cent growth rate in 2015-16.
The only area where there has been a spurt in growth in government spending (public administration, defence and other services) where it is expected to grow at 11.2 per cent in 2016-17 compared to 6.9 per cent in 2015-16.
The difference in growth rates in Q3 of 2016-17 compared to Q3 of 2015-16, especially in case of Private Final Consumption Expenditure (PFCE) and Government Final Capital Formation (GFCF) for Q3 in 2015-16 and 2016-17, is interesting but not puzzling. The PFCE in Q3 of 2016-17 stood at 58.7 per cent compared to 57.1 per cent in 2015-16, and the GFCF for Q 3 in 2016-17 is 29.1 per cent and in Q3 of 2015-16 it stood at 30.0 per cent.
The expectation that the effects of demonetisation should have been conspicuously evident in the Q3 figures is slightly misplaced. Demonetisation came into effect on November 9, 2016 and as Q3 is concerned its effects till December 31, 2016 are to be measured. But remember that Q3 begins on October 1, 2016, and a lot of expenditure would have occurred in the festival month of October, and whatever the downward slide in the second half of Q3 will not be too visible. We need weekly measures between November 9 and December 31, 2016, to get a measure of the effects of demonetisation.[/vc_column_text][/vc_column][/vc_row]
 India News23 hours ago
 India News8 hours ago

 India News8 hours ago

 Latest world news8 hours ago
 India News2 hours ago
 Cricket news2 hours ago
 Latest world news2 hours ago
